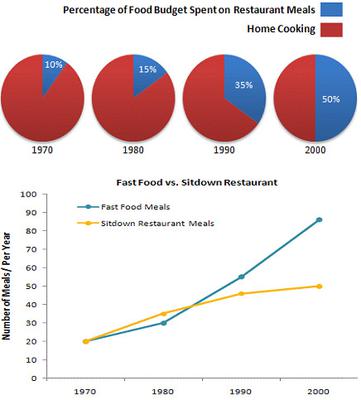
The pie-charts given above show the change in the allocation of the food budget of an average family over 30 years from 1970 to 2000. The line graph shows the change in fast-food meals and sit-down restaurant meals per year for the average family over the same period.
It can be observed that 90% of a family’s budget was allocated for home cooking in 1970, which decreased through the years. It reduced to 85% in 1980, 65% in 1990 and by the year 2000, families were spending equal proportions of their food budget on home cooking and restaurant meals.
From the line graph, it can be seen that families had an equal number of fast-food meals and sit-down restaurant meals, at 20 each in 1970. From 1970 to 1980, annual sit-down restaurant meals increased from 20 to 35, but annual fast-food meals rose from 20 to about 30. After this period, fast-food meals experienced exponential growth. They were recorded at 90 per year for the average family in 2000, whereas sit-down restaurant meals were recorded at only 50 per year in 2000. This reflects a global trend wherein fast-food restaurants such as KFC and McDonald’s have gained popularity, and families visit them to spend time together and enjoy the food and ambience.
Hence, it can be concluded that families increased their budget allocation for eating out from 1970 to 2000, and the number of fast-food meals grew at a much higher rate than the number of sit-down restaurant meals.


 0
0

