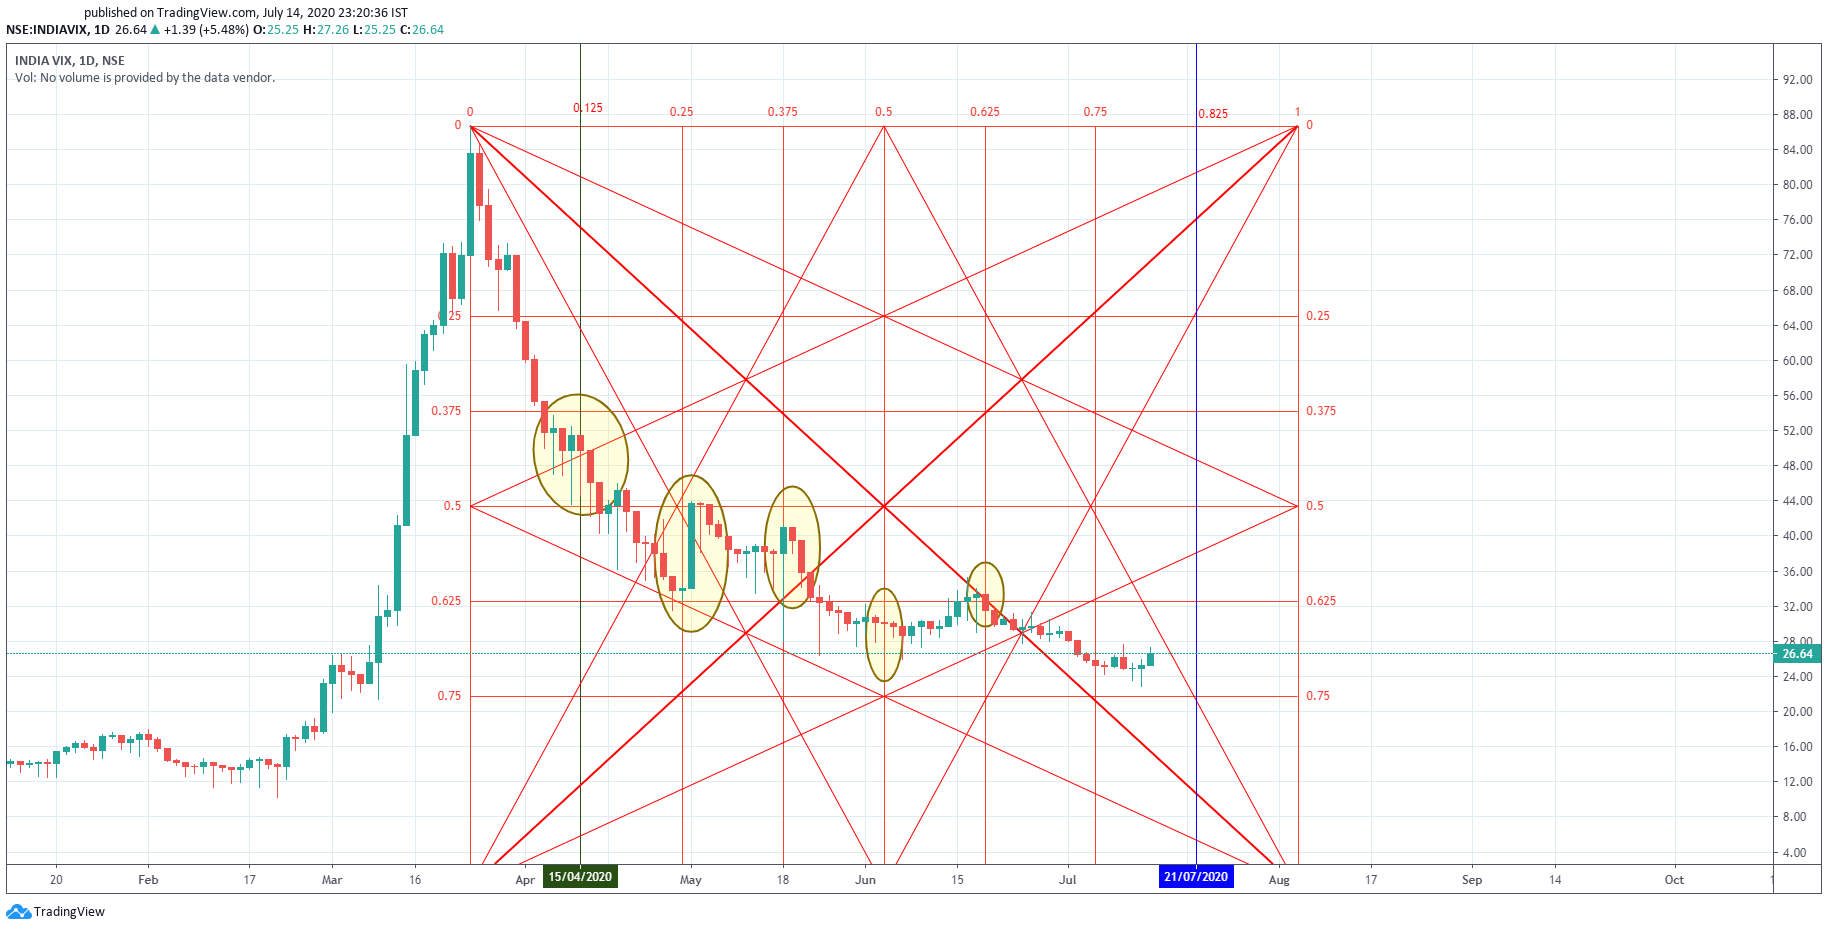
The daily VIX chart shows the formation of Doji candles at the bottom and reversal. The daily RSI crossed the previous resistance level of 40. The MACD signal gave bullish crossover suggesting bullish move in VIX. So the daily chart shows the possibility of VIX moving towards 28 levels in the coming days.
The weekly chart shows the formation of wedge and reversal from the bottom. VIX may move towards the upper wedge line @ 29-30.
So VIX suggesting the bearish mood of the market and hence the high possibility of fall in Nifty-50 and Banknifty in the coming days/weeks.

 0
0


