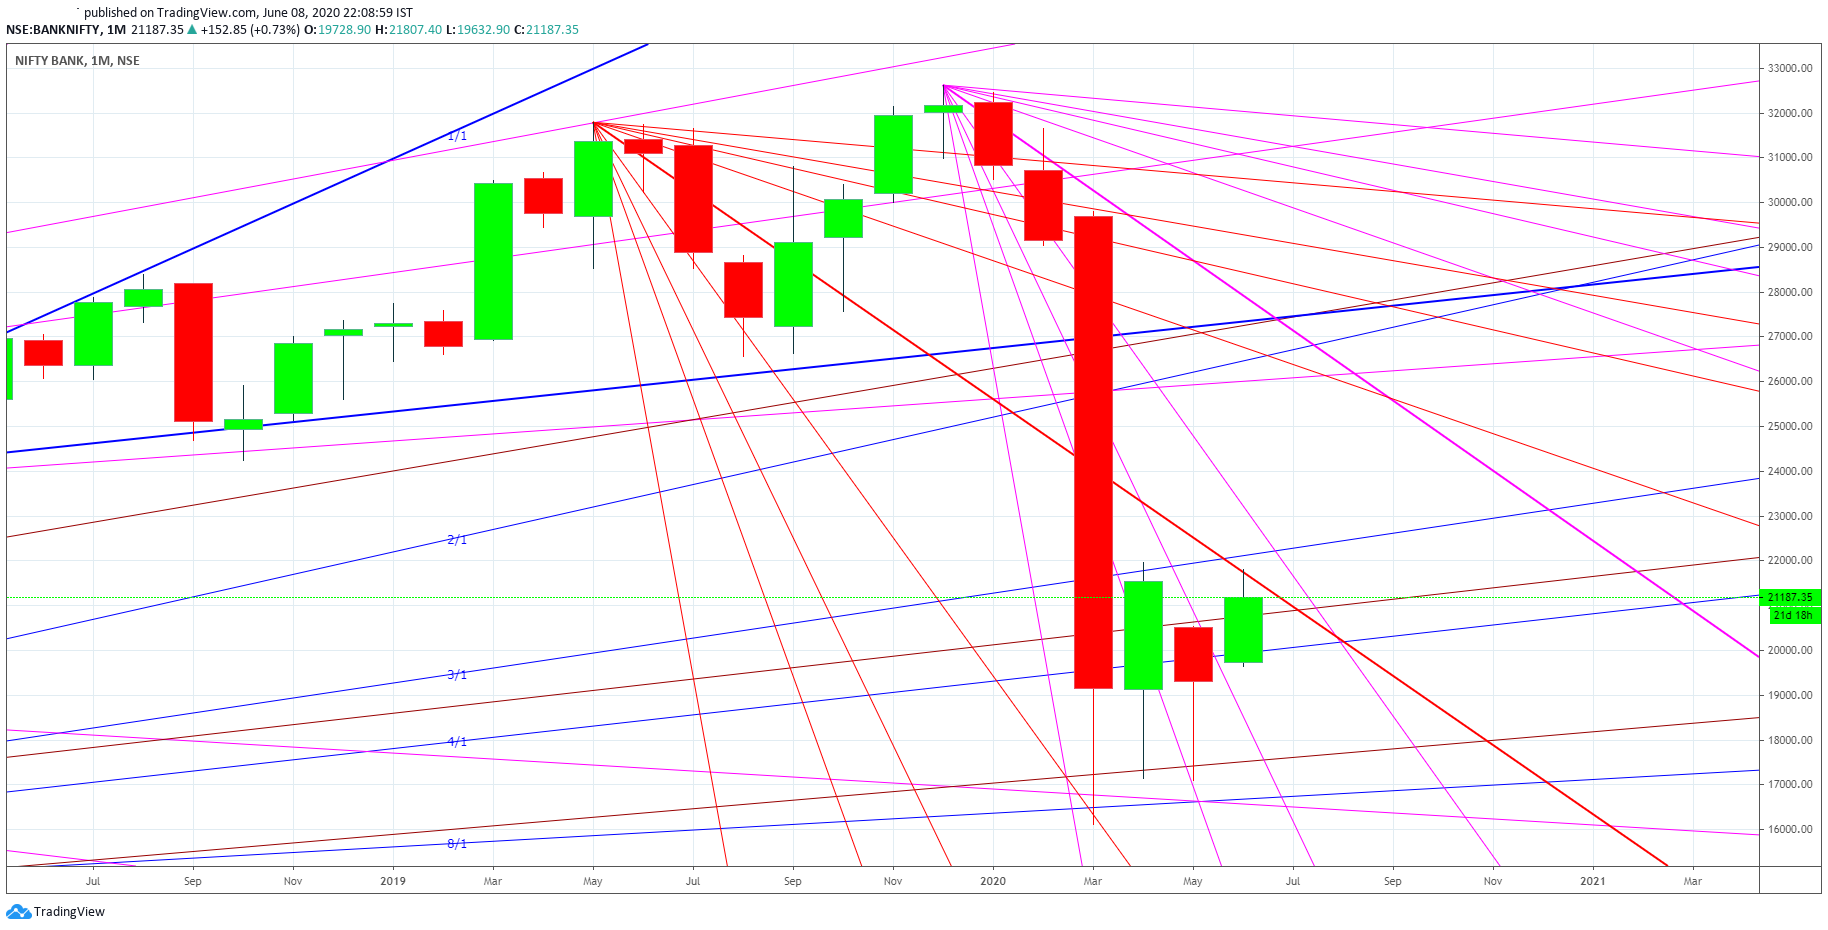
Banknifty opened Big gap up @ 21636 and immediately hit our primary target of 21800 (Top @ 21807). It found strong resistance @ 21800 levels, a Gann Number, and reversed sharply making low @ 20911 almost 900 points down move from the top. It closed @ 21187. So it still holds 21100 levels. For the last two days, it was pure Gann Number Play from 20400-21100-21800 and back to 21100.
- On a daily chart, RSI shows the possibility of an "M" pattern (Jun-3 and today's RSI are exactly 61 levels-61.32). That suggests the possibility of a down move.
- On the hourly chart, MACD is showing bearish divergence, indicating momentum on the upside is reducing. Also, Banknifty is above moving averages support levels. So we can till see upside moves that can be of terminal patterns as shown by lines if 20400-20300 levels support remains intact.

 0
0


