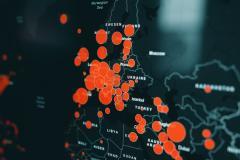
Tableau's user-friendly interface and robust features make it accessible to both technical and non-technical users, enabling a broad range of individuals to leverage the power of data visualization and analysis.
This tool allows you connecting different data sources, data warehouses, cloud files, big data, spreadsheet data, non-relational, and several other types of data. Tableau can blend every kind of data to help organizations for producing attractive visualizations.
It also allows you to create visualizations as simple as a bar chart or a pie chart, as well as more complex ones like a histogram, Gantt chart, Bullet chart, Motion chart, Treemap, Boxplot, and many other
Goal of Course
- Communicating Business Information And Explanations.
- Communicating Comprehensive Data And Commentary That Complies With Reporting Requirements And Addresses Possible Investor Concerns.
- Providing Accurate Information On The Amount, Completeness, And Compliance With Reporting Requirements And Accounting Standards.
Key Modules
- Tableau Desktop Interface
- Connecting Data Sources
- Organizing and Formatting Data
- Adoc Calculations
- Visualizations
- Create Dashboards and Stories


