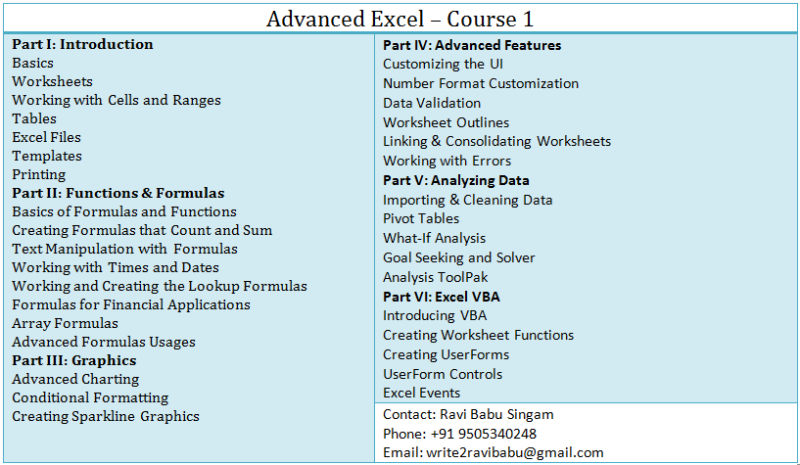
Master the advanced concepts of Excel Data Analysis and Statistical Analysis in 90 Hours with plenty of examples. Students will be receive soft copy of the course material, and practice Excel sheets.
Topics Covered
1. Fundamentals 2. Range Names 3. Functions In-depth: Text, Date, Financial, IF, Time, 3-dimensional, COUNT, SUM, AVERAGE, OFFSET, INDIRECT, and Array 4. Using net present value criteria to evaluate investments 5. Circular references 6. Sensitivity analysis with data tables 7. The Goal Seek command 8. Using the Scenario Manager for sensitivity analysis 9. Conditional formatting 10. Sorting, Filtering data and removing duplicates 11. Tables 12. The analytics revolution 13. Optimization with Excel Solver 14. Solver to: determine the optimal product mix, to schedule your workforce, to solve transportation or distribution problems, for capital budgeting, for financial planning 15. Importing data from a text file or document and from the Internet 16. Validating data 17. Summarizing data by using histograms and by using descriptive statistics 18. PivotTables and slicers to describe data 19. The Data Model 20. Summarizing data with database statistical functions 21. Consolidating data 22. Creating subtotals 23. Estimating straight-line relationships 24. Modeling exponential growth 25. Using correlations to summarize relationships 26. Introduction to multiple regression 27. Incorporating qualitative factors into multiple regression 28. Modeling nonlinearities and interactions 29. Analysis of variance: one-way ANOVA 30. Randomized blocks and two-way ANOVA 31. Using moving averages to understand time series 32. Winters’s method 33. Ratio-to-moving-average forecast method 34. Forecasting in the presence of special events 35. Random variables 36. The binomial, hypergeometric, and negative binomial random variables 37. The poisson and exponential random variable 38. The normal random variable 39. Modeling machine life and duration of a project: Weibull and beta distributions 40. Making probability statements from forecasts 41. Using the lognormal random variable to model stock prices 42. Monte Carlo simulation 43. Optimal bid 44. Simulating stock prices and asset allocation modeling 45. Using resampling to analyze data 46. Pricing stock options 47. Determining customer value 48. The economic order quantity inventory model 49. Inventory modeling with uncertain demand 50. Queuing theory: the mathematics of waiting in line 51. Estimating a demand curve 52. Pricing products by using tie-ins and by using subjectively determined demand 53. Nonlinear pricing
Who should attend
Any one who want to increase the chances of employ-ability and get promoted faster in his/her career.
Pre-requisites
A student should know the basic concepts of MS Excel
What you need to bring
Presence of Mind. And Passion to Learn.""
Key Takeaways
Notes of the subject. Practice material.


